Sobre gráficos bien usados e infografías
Encontré un lindo artículo para aprender sobre infografías. Se explica desde por qué existen...
"Infographics exist because we recognize visual patterns faster than we read text."
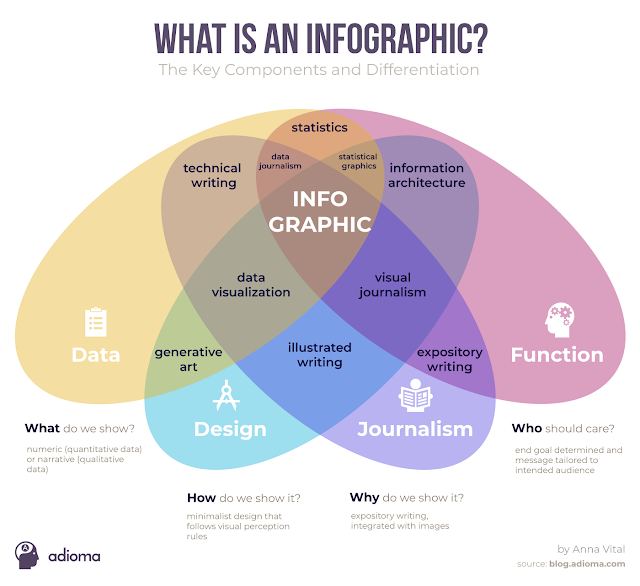
... hasta cómo se componen:
"The concept of an infographic straddles the fields of design, journalism, statistics, and information architecture....Information is what is shown, the design is how it is shown, journalism is why it is shown, and the function is who it is shown to."
El blog está repleto de ellas, así como de artículos muy bien logrados. En particular me gustó uno llamado How To Think Visually Using Visual Analogies al que llegué gracias a Jimena Ocampo (gracias Jime!). Justo hace pocos días hablaba con un colega de la importancia de elegir bien los gráficos a utilizar en ciertos tableros de indicadores y de lo mal que se usan algunos de ellos.
Seguimos pensando..

Comentarios
Publicar un comentario
Muchas gracias por comentar. Por favor deja tu nombre y/o email, los comentarios son mucho más valiosos cuando se sabe quien los hace.